DotWatcher.cc


Free-Route ultra-distance races are races with only checkpoints or as their route cues, like the . Riders must then plot a route between them and compete both in physical riding but route efficiency.
In conversation with Pawel Pulawski, Nicky Shaw finds out what it takes to plan a free-route for an ultra-race with 3rd place finisher of TCRNo8 and organiser of the Race Through Poland.
Where do you start when planning a free route for a race?
How would you go about planning the route for a free route ultra-distance race, from roughing it out down to the detail? Share with us your thought process for working from the macro to the micro level.
With a race like All Points North (APN), which has ~10 checkpoints, it is more difficult than a race with fewer checkpoints such as The Transcontinental (TCR), which only has four checkpoints. With APN you first have to try and decide which order to tick those checkpoints off, but the fact that the checkpoints of The Transcontinental are approached in a specific order simplifies things greatly. When I was building my routes for the three editions of APN, my starting point was to put all the checkpoints as POIs on the map in order to see the big picture. And from there try to decide the best order of checkpoints at the macro level, basically using a combination of sensible judgement and intuition! It comes down to trial and error; there's no right or wrong way but the aim is to create a route with the lowest distance and elevation whilst also taking into account variables such as wind direction and terrain, clockwise or anticlockwise.
Once a sensible order of checkpoints is decided the real fun starts, and I will work on separate routes for each leg between checkpoints which allows for more detailed planning and refinement. Of course, with races that already have a mandatory order of checkpoints, this simplifies things. However, it can be the vast distance between checkpoints such as on The Transcontinental which makes route planning a crucial aspect of race preparation. With the map type set to 'Terrain', the map colour and contour lines clearly define the mountainous and flatter areas. Removing any unnecessary elevation gain is my first priority before trying to reduce the distance. With the routing type set to 'Driving' this can keep the route on paved roads and avoid any slow bridlepaths or footpaths which I want to avoid.
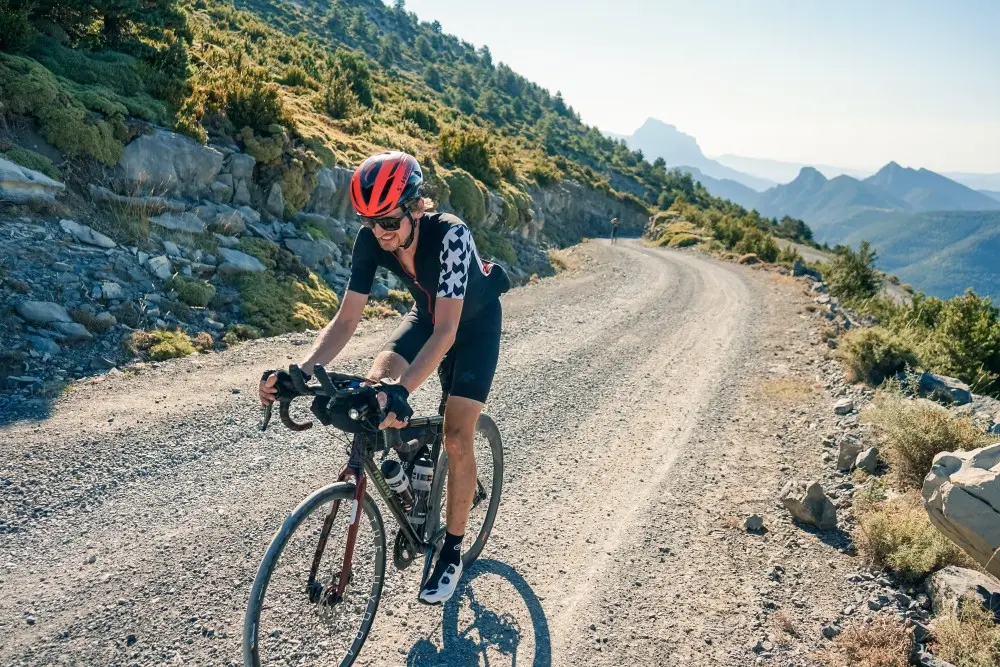
Photo of Piko by TransIberica Club
On the RWGPS route planner, it's possible to view several routes on the map at the same time, which is incredibly useful in comparing the statistics for different options. The statistics include distance, elevation, estimated ride time and surfaces (paved/unpaved/unknown). The estimated ride time is tailored to my personal riding history, and obviously, the option with the lowest ride time will be favoured. I will generally flick between multiple options, check them and edit them accordingly to create the best option. The process of editing and refinement comes from looking at all the individual roads and constantly searching for better options. For instance, rather than going directly over a hill, an alternative road to the North or South might be half a kilometre longer, but it will save 100m of climbing. Right away, the statistics will alter and this instantaneous feedback lets me know if this tweak is worthwhile or not. Looking back at the bigger picture, the predicted time for each route segment between checkpoints can be used to give an idea of the overall race duration. Once additional time for things such as resupply and sleep has been factored in, I can use this tool to build a race strategy and plan where I aim to be at certain points in the race.
How can Heatmaps be used to inform which roads or trails to take?
The heatmap displays 'heat' generated by cyclists worldwide using the two most recent years of publicly logged trip data, how useful is this feature when planning a free route?
I use heatmaps a lot and depending on the race, I'll use either personal or global heatmaps. For example, when plotting the route for APN last year, I could make use of personal heatmaps to see where I'd been on the previous two editions. I could remember the roads and climbs and certain bad choices which I knew to avoid. Having that historical data can be really helpful in making informed choices.
Global heatmaps are best used around somewhere you haven't been before as they give an idea of popular routes and less popular routes which are best avoided. It is particularly useful when Google street view is unavailable and the place is unfamiliar. For instance, when planning a route through Bosnia for The Transcontinental last year, there's very limited street view information so the heatmaps can inform which roads are potentially safer. Those which are totally empty are best avoided, on the assumption that they are too busy for cyclists or restricted in some way. Germany is another place with no street view, but with the global heatmap data, I was able to see where the locals ride and find some really fast cycle lanes.
Google street view is my first point of call when assessing road quality, then heatmaps are the next best thing. It can still be a risk especially if the route is off-road, and you never quite know what you're going to get until you get there! For off-road routes and gravel shortcuts, a combination of heatmaps and satellite views can be used to assess the surface quality. It can also work the other way around when looking for good quality gravel, for instance when planning a route for Gravel Attack, a gravel race in Poland.
How important is it to balance distance and elevation, what tools can be used to achieve this?
The shortest distance isn't always best if it has a lot of steep climbs or elevation change, which inevitably reduces average speed. It's always a fine balance between elevation and distance and also personal preference. For instance, a strong climber might prefer to take a more direct route over the hills in order to keep the overall distance as low as possible. I aim for balance and have a system to test how different routes will have an impact on the climbing. The system is quite simple and involves plotting two control points at either end of the section of routing I want to edit. The control points will pin the route line in place, so when the route is dragged onto a different road, the rest of the route on either side of the control point remains the same. By highlighting the new section of the route in the elevation profile beneath the map, I can see detailed metrics such as elevation gain or loss and estimated ride time. By hovering my cursor over the route or elevation profile I can inspect the gradient at any point. I can use the data to compare options, and I also want to ensure that any reduction in distance isn't hugely compromised by a lot of climbing or very steep hills!
When planning for ultra-distance races, the routes can be very long so it's easy to underestimate the gradients when looking at the elevation profile as a whole. Highlighting sections of the route to see them in more detail is really important in getting a better idea of the climbs involved. It also depends on what point in the race I'll be when choosing the amount of climbing. For instance, I'm more likely to opt for a shortcut involving a steep 20% climb towards the beginning of the race instead of the end. If the climbing can be weighted in the first half of the race, then this will generally be faster when the legs are fresh. This strategy is specific to something like All Points North, where the route could be taken in a clockwise or anticlockwise direction. So, whichever option enables me to get more climbing out of the way sooner is better!
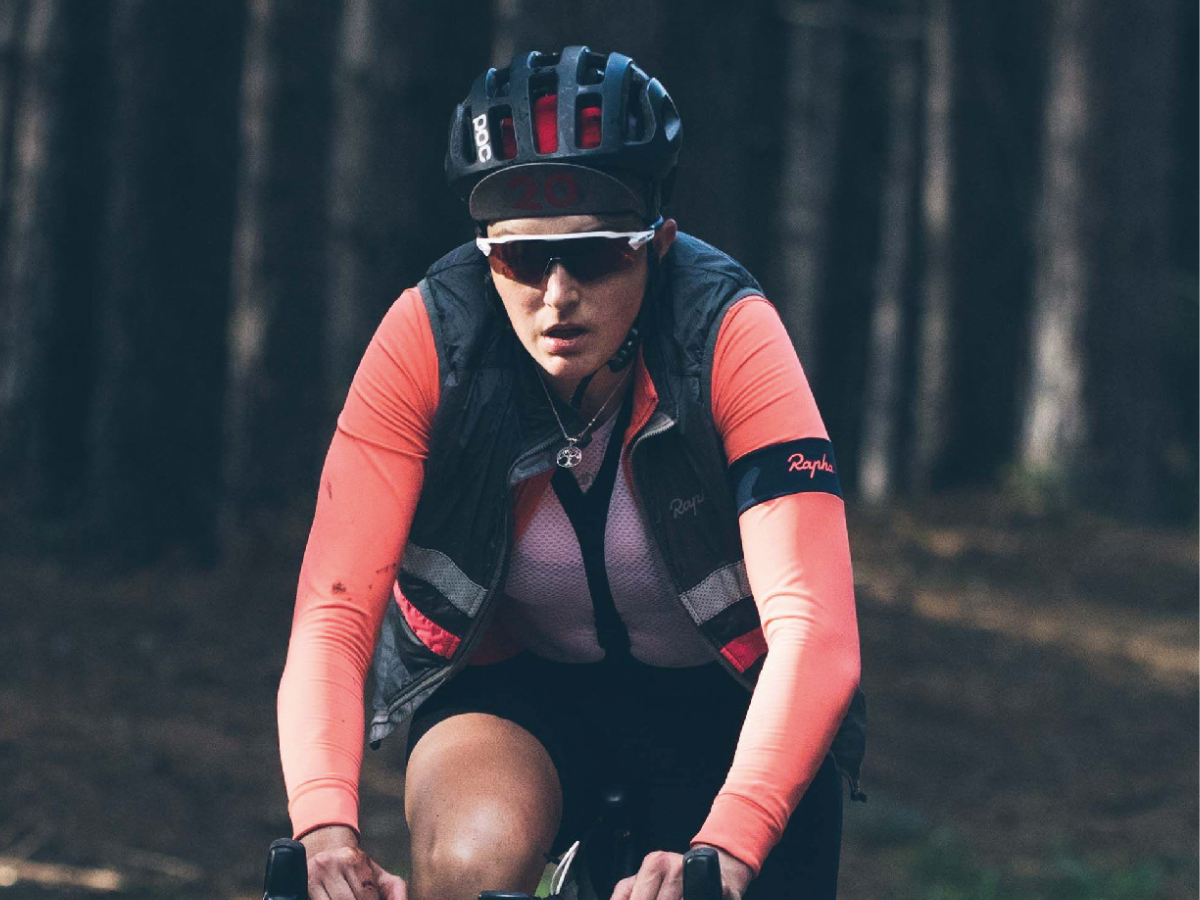
Piko at Race Across France by Assos

How do you incorporate custom cues and points of interest (POIs) into your route planning and race strategy?
When roughing out the first draft of the route I like to plot POIs to see where the control points are along with potential stops and resupply points. When the routes have been refined in more detail and before downloading the GPX files, I'll add custom cues. The custom cues are great as I can name them whatever I like and they will show up on the Garmin. It could be anything I need to be aware of such as a checkpoint, a big climb coming up, a water tap, a shop or potentially bivvy spot.
Cues can act as mini goals, and in such a long race I find it useful to have goals to tick off during each track, such as the top of a hill in 5km or the end of a gravel section in 8km. Once all the custom cues are plotted I can check through them one by one using the cue review tool before saving the cue sheet. It's really useful to have this list of cues to hand as it shows the relative distance for each cue. RWGPS will automatically include turn-by-turn directions as cues, but I generally delete these and prefer and keep an eye on the map view of my Garmin while making a mental note of any turnings or junctions coming up.
Once I'm happy with the route and all the custom cues have been plotted, I split it into 160 - 180km segments manually, or the split route tool could be used. Each file is reduced to 500 points to reduce the file size, and the cues are included as waypoints. One thing I always do is create a short overlap of about 5km between two routes. This means that when coming towards the end of one track, I can upload the next file at a convenient point during the 5km overlap and I don't need to stop somewhere inconvenient. In case something goes wrong with the Garmin, as a backup I usually carry two phones with the GPX files and routes saved offline on the RWGPS mobile app.